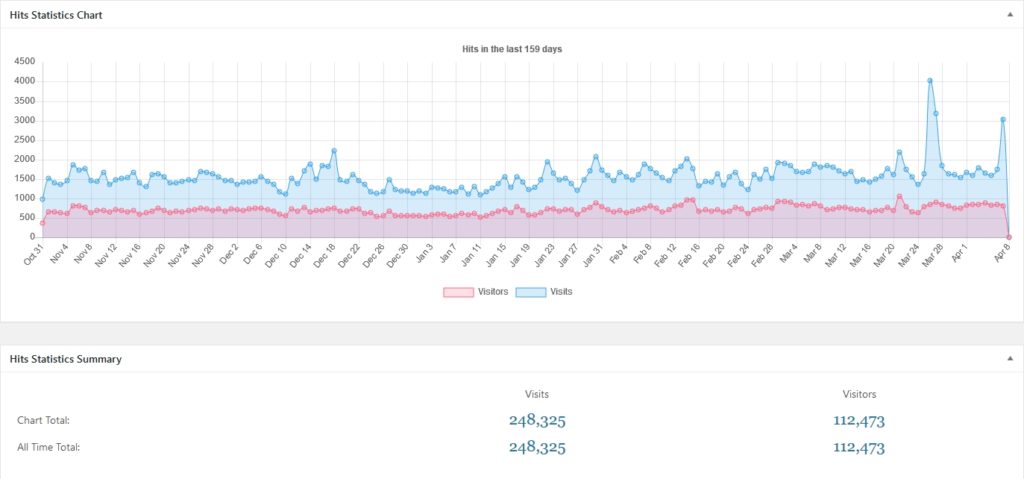
Since the beginning of November, when the software started to record the amount of traffic, to March 2018, these were our top posts.
In that time, the total traffic was 247,795 visits from 112,329 unique visitors. That’s an average of 2.2 visits each at a daily rate of 1640 visits by over 740 visitors.
Views: 205


So?
Hi Mike,
I’m reporting how many people are reading through the blog, nothing more than that. I was intending to report a bit more often than once in several months, but never mind. One hundred and twelve thousand people making a quarter of a million visits in five months shows a widespread interest in climate scepticism.