Wikipedia: Simon is a common name, from Hebrew שִׁמְעוֹן Šimʻôn, meaning “listen”.
Listen, Simon.
Two weeks back Simon said the following and I was just too busy to respond. He makes what may seem obvious and sensible points but simply regurgitates the great global warming myths which by now have been so utterly proven false that they are pathetic. However, not all our bystanders know this, so I shall do it again. Simon makes nine separate points:
- Carbon neutrality does not mean banning burning of hydrocarbons.
We are not naive, Simon, and neither should you be. There are plenty of activists telling you otherwise. James Shaw, Greens co-leader, says the banning of future offshore oil and gas exploration marks “the beginning of a new and exciting future for Aotearoa New Zealand,” the Coal Action Network tells us to “Leave it in the hole,” Greenpeace is right now defending a criminal charge after dangerously interfering at sea with a marine survey vessel, and the Guardian was lamenting four years ago that “… leaving fuel in the ground is the crux of the issue.” And that’s only a minute portion of the anti-hydrocarbon screaming. The activists are inflexible about the danger of hydrocarbons, so you cannot claim that you’d be content if we simply made do with less. You lot want to shut down our use of hydrocarbons. It’s perfectly plain, from the Prime Minister down.
- The greenhouse effect is well understood.
Perhaps, and because it causes floods we should battle to stop the rain? We quantify potential risks to learn whether it’s a problem. Establishment climate scientists haven’t taken the quantification of climate sensitivity very seriously, so the range of temperatures they suggest is enormous. Which fits the climate scare tactics but leaves us with no clear target for adaptation. So quantify it.
- Temperatures will continue to increase with atmospheric greenhouse gas concentration.
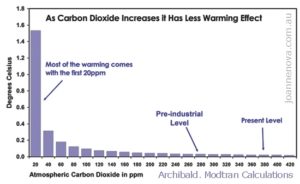
Again, what about quantifying that? The truth reveals the perfect harmlessness of increasing CO2. This graph of temperature response that I republish yet again shows how little the temperature rises with rising CO2. Try to grasp it this time.
- The cost of adaptation exceeds the cost of mitigation.
This is a fairy story, since hydrocarbons are the densest, cheapest and most convenient energy source available, so any change to “renewables” involves higher costs, unless we get serious about nuclear power. Still, just in case it’s true, justify your assertion: again, it means quantifying.
- Net zero greenhouse gas emissions has to occur at some point.
Why? Mother Nature will never stop turning over CO2, she needs it. Our accumulated contribution to CO2 is less than 6%, after about 150 years.
- There are no deceptions over temperature records.
There are plenty of overseas examples of deceptive practices, from NASA/GISS to the UEA, but we don’t need to leave New Zealand to demonstrate this. Have a look at A Reanalysis of Long-Term Surface Air Temperature Trends in New Zealand by de Freitas, Dedekind and Brill. The abstract says: “Current New Zealand century-long climatology based on 1981 methods produces a trend of 0.91 °C per century. Our analysis, which uses updated measurement techniques and corrects for shelter-contaminated data, produces a trend of 0.28 °C per century.” That’s the latest peer-reviewed science that in four years has had no peer-reviewed reply.
If you truly believe there are no deceptions over temperature records, then you absolutely must explain why NIWA today trumpets on its website in denial of what you say:
NIWA’s ‘seven-station’ temperature series uses temperature measurements from seven ‘climate stations’. The locations were chosen because they provide a representative geographical spread across NZ and have reliable records dating back at least to the early 1900s. The linear trend in the annual average temperature over the period 1909 to 2016 is a warming of 1.02ºC (or a rate of 0.95ºC per 100 years).
Our premier climate institute completely ignores the peer-reviewed science and parades their own incorrect, wrongly calculated results for the national temperature record, even four years after the de Freitas paper!!
- The IPCC does not misrepresent established climate science.
Yes, it does that frequently. An example. In 2005, for the AR4, it intended to claim in the name of Chris Landsea, a subject matter expert, that “global warming was likely to continue spurring more outbreaks of intense hurricane activity.” They were wrong; Chris Landsea objected, Dr. Kevin Trenberth ignored him, so Chris resigned from participating in the AR4. Trenberth is still with the IPCC.
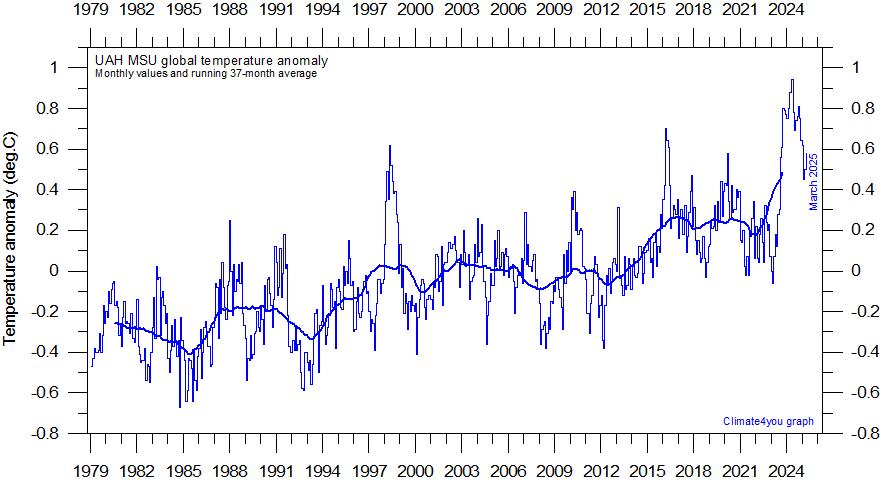
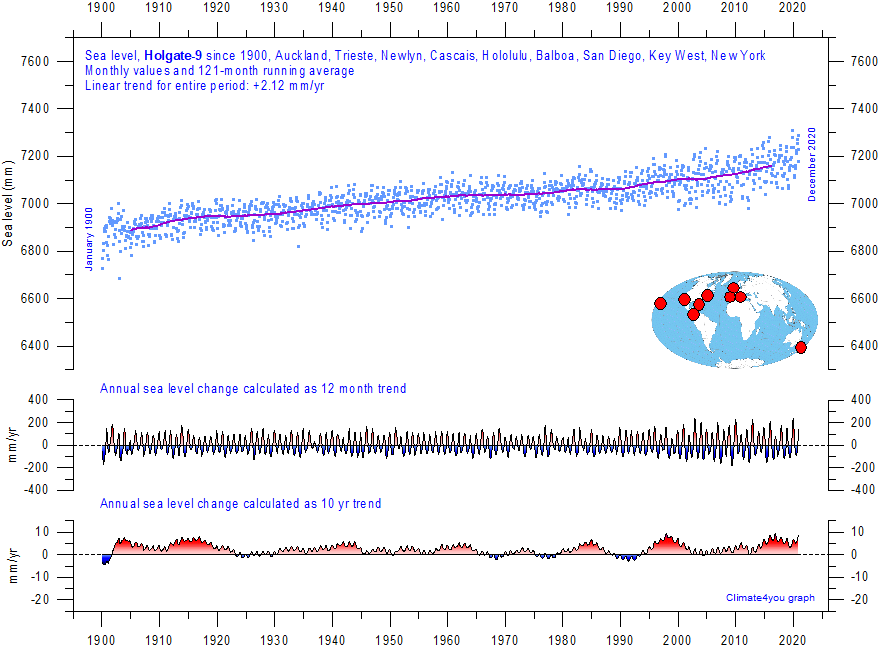
- Temperature and sea levels are rising.
Some temperature increase over 40 years, lots of variability, most recently declining:
Sea level has been rising for a few hundred years but no recent acceleration:
- Anyone who denies these facts is, by definition, a ‘denier’.
Yes, but I don’t agree with your assertions, as I show. You must agree that affirming a different truth necessitates denying the lie.
One thing further: nothing in my response could be construed as insulting, but there you go again insulting me.
Views: 353


1. I am not sure who ‘you lot’ are but I concur that banning gas exploration in Taranaki was silly. The most expensive sources of hydrocarbons will be staying in the ground. This is happening.
2. Read the literature. Dangerous warming occurs even at low climate sensitivities.
3. Your chart is a crock: http://www.realclimate.org/index.php/archives/2007/10/my-model-used-for-deception/ Learn to discern actual science from charlatans posing as scientists. Hint: you won’t find serious scientific discourse at joannenova.com.au
4. Read the IPCC Summary for Policy-makers and the Stern Review. Finite fuel sources tend to increase in price as availability declines. Renewables aren’t finite resources.
5. Net zero greenhouse gas emissions has to occur in order to maintain an equilibrium global temperature.
6. Homogenisation techniques aren’t deceptive. The de Freitas paper has been shown to be seriously flawed and should be disregarded. https://link.springer.com/article/10.1007%2Fs10666-018-9606-6
7. Scientists sometimes disagree on stuff. This is indicative of a healthy process. Dr Trenbeth is probably correct, more warmth = more energy = more powerful hurricanes. For more information see https://www.gfdl.noaa.gov/global-warming-and-hurricanes/
https://www.c2es.org/content/hurricanes-and-climate-change/
8. Thank you for confirming my assertion that temperatures and sea levels are rising.
Some of your ‘different truths’ are actually lies, e.g, the above Archibald graph.
Simon,
My chart? You’re going up against the University of Chicago and the US Air Force, buddy.
From Wikipedia, the free encyclopedia: MODTRAN (MODerate resolution atmospheric TRANsmission) is a computer program designed to model atmospheric propagation of electromagnetic radiation for the 100-50,000 cm−1 (0.2 to 100 µm) spectral range. This covers the spectrum from middle ultraviolet to visible light to far infrared.
The most recently released version of the code, MODTRAN6, provides a spectral resolution of 0.2 cm−1 using its 0.1 cm−1 band model algorithm.
Some aspects of MODTRAN are patented by Spectral Sciences, Inc. and the US Air Force, who have shared development responsibility for the code and related radiation transfer science collaboratively since 1987.
The acronym MODTRAN was registered as a trademark of the US Government, represented by the US Air Force, in 2008.
I’ve never heard of Archibald’s discussion, nor “Real” Climate’s rebuttal. Does crock mean wrong? Do you want to explain that?
You jumped at the chance to malign two prominent sceptics, so shame on you. It would have been more instructive to Google MODTRAN instead of Archibald, wouldn’t it? Charlatans posing as scientists, eh? I suppose you’re trying to say you disagree with them; you’re being corrosive instead of just telling us why you disagree. But you tell me what to learn. Yeah, that’s reasonable.
At least we agree on point (1)
Maybe we should pause there and raise a glass to rationality
I’m not convinced, but cheers anyway.
Archibald is the crock, not the MODTRAN model. He applied a climate sensitivity of 0.1 degree C per Watt/m²
which equates to an ECS of 0.4 degrees for each doubling of CO2. The generally agreed range is an ECS between 1.5 and 4.5C.
Time and time again you are duped by charlatans who tell you what you want to hear. You need to learn to be discerning and confirm your sources.
Just cannot stop the abusive ad homs can you Simon. Sign of a what – I’ll let you figure that out. When you try to get sciency, it flops. There is a reason for that.
Please tell us the facts behind your ECS claims .
It is stupefyingly hot here in the UK even in the middle of the night. Look at the graphics to how the world is warming.
https://www.theguardian.com/uk-news/2018/jul/24/why-is-europe-going-through-a-heatwave
Richard Treadgold. Funny how you don’t have time to learn some science from Oxford professor Myles Allen but can always quote plenty of fake science from cranks like de Freitas and other liars.
Steph,
But that’s normal in mid-summer, especially during a heatwave.
That’s poor grammar, but read the graph again. The legend shows that colours are related to the “Variation from 1951 – 1980 average.” So it’s no surprise that 40 to 60 years later temperatures are higher (there was a bit of warming). Note the scale: it shows variations of ±0.0°C, ±0.1°C, ±0.2°C, ±0.5°C, ±1.0°C, ±2.0°C and ±4.0°C, thus exaggerating the increases under 1°C. It shows a tremendous warming in the Antarctic and practically no warming in the Arctic, which flies in the face of observations over 20 years or more. Even though neither pole is melting, I don’t believe the graph; it lies.
You may notice, if you read the Guardian story again, that even Prof Myles Allen concedes that “a human influence” is simply “playing a role” in this heatwave, it’s not the only player. You’re making a mountain out of a molehill. This does not prove that dangerous anthropogenic global warming is happening.
Odd, isn’t it, that last winter, when the UK was struggling under the coldest temperatures in decades, you said nothing about the imminent cessation of global warming. Yet in a hot summer you leap to accuse others of not believing in DAGW. You’re also full of abuse.
If I “quote fake science” then take me down, don’t mouth empty words.
Liars, you say? Prof de Freitas was a scientist who published more papers than you can understand and he had earned an excellent reputation over decades before he was taken from us. You have a poisonous mouth. Keep it up and I’ll silence it.
I suspect that ‘Simon’ and ‘Stephanie’ are useful idiots with full membership of Socialist Internationale. Misreading a graph and getting something as basic as attribution wrong are what was once known as ‘schoolyard howlers’ and if they can’t understand such basic concepts, all their advanced language is mere ranting.
Cut them off at the pass, Richard, they are a waste of electrons, oxygen and time..
Simon,
You’re right, there are legitimate adjustments that should be made to temperature readings. But there are examples from around the world of illicit adjustments that introduce a false warming trend; this is well documented, and there’s an extended series of articles on this site regarding NIWA’s 7SS. They were forced to reconstruct the national temperature series because they couldn’t answer our criticisms and they had lost the original calculations. The de Freitas paper has no flaws, but there are errors in Mullan’s “NIWA Comment” on it. See
Alexander,
Yes, I may need to. But I enjoy challenging questions, as they are a challenge. So if the abuse is kept down to a dull roar I’m prepared to entertain them.
Steph, its weather, get over it.
Its been lovely though hasn’t it.
This is an excellent read. Back in the 1970 and 1980s; bipattisan politicians, industry, and scientists fixed ozone depleting and very nearly greenhouse gas emissions as well.
https://www.nytimes.com/interactive/2018/08/01/magazine/climate-change-losing-earth.html
https://www.theguardian.com/news/2018/aug/03/denialism-what-drives-people-to-reject-the-truth