If these files are of interest you are welcome to download and make use of them.
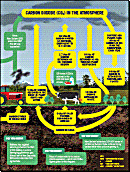
NZ’s carbon and nitrogen cycles
A two-page graphic recently developed by NZ’s Ministry of Agriculture and Forestry (June, 2009). It shows the numbers and the reasoning behind much of NZ’s GHG emissions reporting policy.
NIWA’s NZ temperature data, 1853 – 2005
The adjusted temperature data produced by Dr Jim Salinger and kindly sent to us by Mr Warwick Hughes. It’s in an Excel spreadsheet, it does not include the adjustments made to the raw data and when plotted it produces the graph on NIWA’s web site showing strong warming during the 20th century.
A historical annual temperature dataset for Australia

A paper by Simon Torok and Neville Nicholls in 1996. Kindly sent to us by Ken Stewart.
NZ ETS review, 2011
On December 23rd, 2010, the NZ government announced a review of the ETS, to report by June 3, 2011. Climate Change Issues Minister Nick Smith announced the panel membership. Download here a copy of the Terms of Reference for the review (pdf, 58.5kb). Also available from the Government’s Beehive web site.
Views: 655

