Strange new paper on NZ climate – Part 2

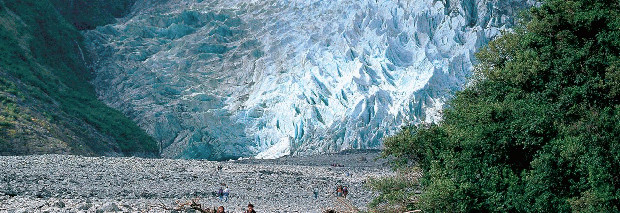
Franz Josef glacier, New Zealand

Stupefying reversal after all the propaganda

The warmsters have been squawking at us since the IPCC was founded in 1988 for using abundant, affordable hydrocarbons to power engines and to create all kinds of materials, from the ordinary (like tar and ink) to the fantastical (like heart valves and aspirin). They demand we stop drilling anywhere, stop mining anywhere and stop creating affordable products to improve and save lives. But this is blinkered madness oozing from the dystopian IPCC stink-tank.
Continue Reading →

Views: 860

Climate concern misaimed

volcano under ice sheet

Volcano under modern ice sheet. Lava plays havoc with that iceman, I mean ice, man.

• Opinion •

— by Viv Forbes, Chairman of Carbon Sense

“Climate” is formally the thirty-year “average” of weather. Climate is what we expect, on average—weather is what we actually get.

It is true that atmospheric conditions (dust, smoke, smog, aerosols, aircraft contrails, clouds and trace gases) can affect Earth’s weather. But none of these minor atmospheric constituents can generate energy—they merely filter, reflect, transfer or redirect a portion of solar energy. The effects of any changes tend to be short-lived, reversed as the atmosphere clears or they often trigger negative feedbacks that largely offset the initial effect. In particular, carbon dioxide does not drive the weather. No weather forecaster notes what tomorrow’s level of CO2 is likely to be, and no farmer wonders what it will be next spring. Continue Reading →

Views: 356

Giant clam reveals Middle Ages were warmer than today

Giant clam

Giant clam. The scientists drilled tiny, precise holes that exposed daily growth lines and built up a temperature record spanning 2500 years (see below). Click for larger version.

One of the more troubling aspects of the global warming alarm campaign is the claim that modern temperatures are unprecedented. Never before (so the story goes) have temperatures been so high. Those making this claim have striven over many years to ‘get rid of’ the MWP and thus magnify the crisis we face. Continue Reading →

Views: 80

Ocean, not CO2, caused past climate change

oceans

Len Mills tells us of a study showing past climate change was caused not by atmospheric carbon dioxide but by changed ocean circulation releasing heat into the atmosphere.

Most of the concerns about climate change have focused on the amount of greenhouse gases that have been released into the atmosphere, but in a new study published in Science, a group of Rutgers researchers have found that circulation of the ocean plays an equally important role in regulating the earth’s climate. Continue Reading →

Views: 55

Climate research needs redirection

• Guest post •

Governments are running huge deficits, but still spend billions on climate research, especially trying to model the effect of the atmosphere and its trace of carbon dioxide on surface temperature. Benefits are hard to find. It may have improved weather forecasts by a day or so, but official long-term predictions have not improved in the last fifty years. This is because carbon dioxide in the atmosphere is not the driver of weather or climate. Continue Reading →

Views: 70

David Evans devises solar model to tame climate chaos

Jo Nova and David Evans reveal astounding new work

Will this be the magic bullet to destroy climate ignorance?

This from Jo Nova (note her lack of arrogance):

Behind the scenes, for 18 months, Dr David Evans (my other half) has been quietly working full time on climate research. The Fourier expert with six degrees who studied at Stanford has discovered something extraordinary using silicon-chip maths on the climate system. (Electrical engineers are really going to like this new approach.) This is real science laid bare. Continue Reading →

Views: 733

Wind and waves scatter sea ice, not AGW

Antarctic sea ice

Antarctic sea ice can be breathtaking.

Waves chase away warming

A paper has arrived from NIWA that says, in effect, warming is not necessary to explain the disappearance of much sea ice. That it removes a warming element from the polar pieces of the global warming puzzle gives me great pleasure. Well done, them!

I’m talking about “Storm-induced sea-ice breakup and the implications for ice extent” (Nature 509, 604–7), published online in Nature on 29 May, by A.L. Kohout, M.J. Williams, S.M. Dean and M.H. Meylan (KWDM). Its major discovery is that large waves travel much farther through pack ice than hitherto realised, thus breaking up much more ice than we realised and allowing it to be swept away by wind and wave—it hasn’t been melting from the heat of global warming. Continue Reading →

Views: 84

Egos on ice

If you have been following the story of the Akademik Shokalskiy, you’ll know it’s a global warming boat stuck in an Antarctic ice pack. What piqued my curiosity was that the expedition is called ‘Australasian’. Now, I don’t mind when Aussies make absolute fools of themselves, but when Kiwis are involved in the foolishness, I get brassed off. More so when the stupidity is funded by my taxes. Continue Reading →

Views: 161

Sherpas sick of ‘climate change’

via BBC News – Everest Sherpas in glacial lake study warning. – h/t Ron.

“The situation has become such that many Sherpas in the region do not even want to hear the words ‘climate change’.”

The Mount Everest region’s Sherpas have said they are angry at the way studies of glaciers and glacial lakes have been conducted in recent years.

They say the studies do not involve them and that results are often spread through alarmist media reports that cause panic among locals in the area.

Continue Reading →

Views: 377

Michael Mann threatens legal action over Steyn comment

From Australian Climate Madness – h/t Val Majkus. This is a savage attack on Professor Michael Mann, author of the deceptive “hockey stick” graph published in the Third Assessment Report by the IPCC in 2001. It was the second graph in the report and much used in the publicity material until strong opposition appeared and the graph vanished for a while. Mann has hit back with a lawyer’s letter. It could get interesting for what for the first time would come under the judicial microscope.

caption

WEDNESDAY, 25 JULY 2012 9:28 AM
by SIMON [TURNILL]

If this goes the distance, it will certainly be worth following very closely.

Mark Steyn, writing at the National Review (backup WebCite link here), made a number of comments about Michael Mann regarding the Hockey Stick, and Mann has responded with a three-page lawyers’ letter threatening defamation proceedings (see here: page 1, page 2, page 3 – originally published on Mann’s Facebook page, reproduced here for ease of reference).

The interesting point here is Continue Reading →

Views: 106

Hockey sticks beware – dendro rulz!

A new study shows modern temperatures are not unprecedented and disproves an important part of Mann’s “hockey stick” paper of 1999.

Orbital forcing of tree-ring data, J. Esper et al., says:

“… large-scale near-surface air-temperature reconstructions [specifically the hockey stick] relying on tree-ring data may underestimate pre-instrumental temperatures including warmth during Medieval and Roman times.”

This is beautiful.

Views: 56

The CO2 wasn’t absorbing! Nek minute…

When the Herald reported that an “‘Abrupt increase’ in CO2 absorption slowed global warming” the first question it raised was what sort of increase was an extra “one billion tonnes of carbon per year”. It said:

The earth would have warmed faster in the last two decades had there not been an unexplained rise in the amount of carbon dioxide being absorbed on land, scientists believe.

Fortunately, Jo Nova and David Evans have commented. David describes the billion tonnes of carbon as insignificant. Jo mocks the implication that our selfish warming would have been worse without this previously unknown factor. Continue Reading →

Views: 47

The real climate deniers

Paul Mulshine says it well:

This guy nails it.

The movement to use a theoretical threat from atmospheric CO2 to control other humans is a religion, not a science.

He says the issue is the role of CO2 versus cosmic rays in cloud formation, and “it can be resolved only by physicists, not the crowd I like to call ‘climate scientologists’.” He cites an article about Henrik Svensmark by Robert Tracinski.

Henrik Svensmark

Svensmark, says Tracinski, “has already broken the claim of the man-made global warming “consensus” to be the only scientific explanation of the climate.”

He says:

Ignoring the past is precisely what [the alarmists] have done. Continue Reading →

Views: 53

Levitus rewarmed

lovely iceberg in boundary conditions

Yes, the ocean has warmed; no, it’s not ‘global warming’

And warm water does not sink

Oceanographer Dr Willem de Lange has referred us to a really clear treatment of ocean warming and ocean-atmosphere interaction in an article by a noted oceanographer (now deceased). It appeared in 21st Century Science & Technology magazine in 2000 and carried the “Yes, the ocean has warmed” headline you see above. Though written 12 years ago, it makes a solid rebuttal to the substance of the modern warming scare, emphasizing, as though marine scientists needed to be told, that warm water cannot sink.
 
The author was Dr. Robert E. Stevenson, an oceanography consultant, who trained NASA astronauts in oceanography and marine meteorology, was Secretary General of the International Association for the Physical Science of the Oceans from 1987 to 1995 and was an oceanographer for the U.S. Office of Naval Research for 20 years.

Having completed the post, I’ve discovered the new Levitus paper. How does Levitus et al. 2012 compare with the old Levitus et al. 2000? The new paper is in press, so we only have the abstracts to compare. In 2000, the heat content of the world ocean increased by ∼2 × 10²³ joules between the mid-1950s and mid-1990s, representing a volume mean warming of 0.06°C. In 2012, the heat content of the world ocean increased by 24.0 × 10²² J for 1955-2010, corresponding to a volume mean warming of 0.09ºC.

With 24.0 × 10²² being 20% greater than 2 × 10²³, and the temperature going from 0.06 to 0.09°C giving an increase of 50%, we have a familiar picture. It’s deja vu, only warmer.

Here’s the article’s original introduction:

Contrary to recent press reports that the oceans hold the still-undetected global atmospheric warming predicted by climate models, ocean warming occurs in 100-year cycles, independent of both radiative and human influences.

Which echoes today’s headlines about ocean heat content trying to explain why climate models don’t predict the climate. Continue Reading →

Views: 344

Quote of the week

what a thing to say

An unimaginable proposal

“As a result — and for reasons that remain unexplained — the waters of the Southern Ocean may have begun to release carbon dioxide.”

Scientific American makes the most illogical statement I’ve heard in a while.

If there’s no reason for this event, why would one propose it?

An event is proposed for which no cause can be imagined. The author proposes something he has no reason to believe — or proposes something but can’t imagine why. This is nuts. It’s not science. Continue Reading →

Views: 67

Models of reality

NZCSC chairman Barry Brill has suggested to Environment Waikato that its Regional Policy Statement (RPS) should not be influenced by the climate change ‘Guidance Manuals’ (here and here) issued by the Ministry for the Environment in early 2008. Like the IPCC’s Fourth Assessment Report (4AR), their recommendations have been overtaken by recent scientific papers and data. His submission notes that modelled projections of 21st century warming rely upon two components – emission volumes and climate sensitivity. Here is his comment regarding Climate Sensitivity.

CLIMATE SENSITIVITY (Model Uncertainties)

1: THE IPCC REPORT

The 17 models used for the 4AR produced a 2100 temperature range of 1.8°C – 4.4°C. Note at page 122 of the Manual, “this arises from taking the best estimate temperature change, and subtracting 40% to get the low end, and adding 60% to get the high end of the range”. The “most likely” temperature trend is 2.7C per century. Continue Reading →

Views: 88

The globe is cooling (what it does when it’s not warming)

From Stephen Goddard at Real Science last May (h/t Bob Carter) came this astounding climate forecast from Dr Leona Libby in 1979, just as the global warming scare was starting out.

I’m not sure it’s tracked the actual climate tremendously closely, but there are strong indications (from several horrendously cold northern winters and this last miserable southern summer) that cooling is the new trend.

Libby’s forecast would bear much wider study instead of being ignored for the man-centric theory du jour. Anecdotal evidence and observation suggest this forecast hasn’t been refuted by the theory of dangerous anthropogenic emissions-induced global warming.

On the contrary, the evidence this century is irrefutable that natural variation has been overwhelming the undetectable anthro influence. Continue Reading →

Views: 396

NZ temperature record — it’s worse than we thought

Thanks to those who advised me of this amazing email from the Climategate 2 collection, either through comments here or private email. It concerns the pre-1930 cooling of the New Zealand temperature record, and makes food for thought, especially for those supporting NIWA, Salinger and the increasingly shaky AGW story. Although it’s more of a novel, and a bad one at that, with gaping holes in the plot and evidence so carelessly thrown together it fools nobody. Now, as many of us feared was the case, comes evidence that the NZ temperature record has been applied to far more places than where it was observed. We now know it was stretched over far-flung places it was never intended to go. This is the worst result possible.

Cc: t.osborn@uea.ac.uk
date: Mon, 7 Sep 2009 00:13:56 +0100 (BST)
from: “Tim Osborn”
subject: New Zealand summer temps
to: p.jones@uea.ac.uk

Hi Phil,

just a quick Q before I go to bed!

I’ve just updated the IPCC paleo chapter Southern Hemisphere plot where we
showed, amongst other things, Ed Cook’s New Zealand TRW reconstruction,
with CRUTEM2v Jan-Mar smoothed temperatures.

For my update I’ve used CRUTEM3v, expecting them to be rather similar but
with a few more years on the end.

But the pre-1930 temperatures are now very different, being much cooler
(by > 0.5 degC for a 25-year low-pass mean) in CRUTEM3v than CRUTEM2v.
Previously they had been, on average, near or even above the 1961-1990
mean, now they’re at -0.5 degC.

Is this a result of some homogenization work on New Zealand summer temp
data? Or just some random artefact of minor changes somewhere?

Cheers

Tim

— Dr. Tim Osborn RCUK Academic Fellow Climatic Research Unit School of Environmental Sciences University of East Anglia Norwich NR4 7TJ, UK www.cru.uea.ac.uk/~timo/

Views: 494

More about the NZ temperature record

Errors in the new 7SS

The shocking breakthrough in our audit is that NIWA didn’t use the adjustment method they said they would use. Barry Brill, chairman of the Coalition, released an overview entitled New Zealand Unaffected by Global Warming (pdf, 1.3 MB). The discovery that the country hasn’t experienced global warming is another startling finding. In Chapter 8, on page 24, he identifies nine criticisms of NIWA’s newest 7SS. These multiple defects destroy the credibility of the 7SS as a source of the NZTR. Continue Reading →

Views: 121

No global warming in New Zealand

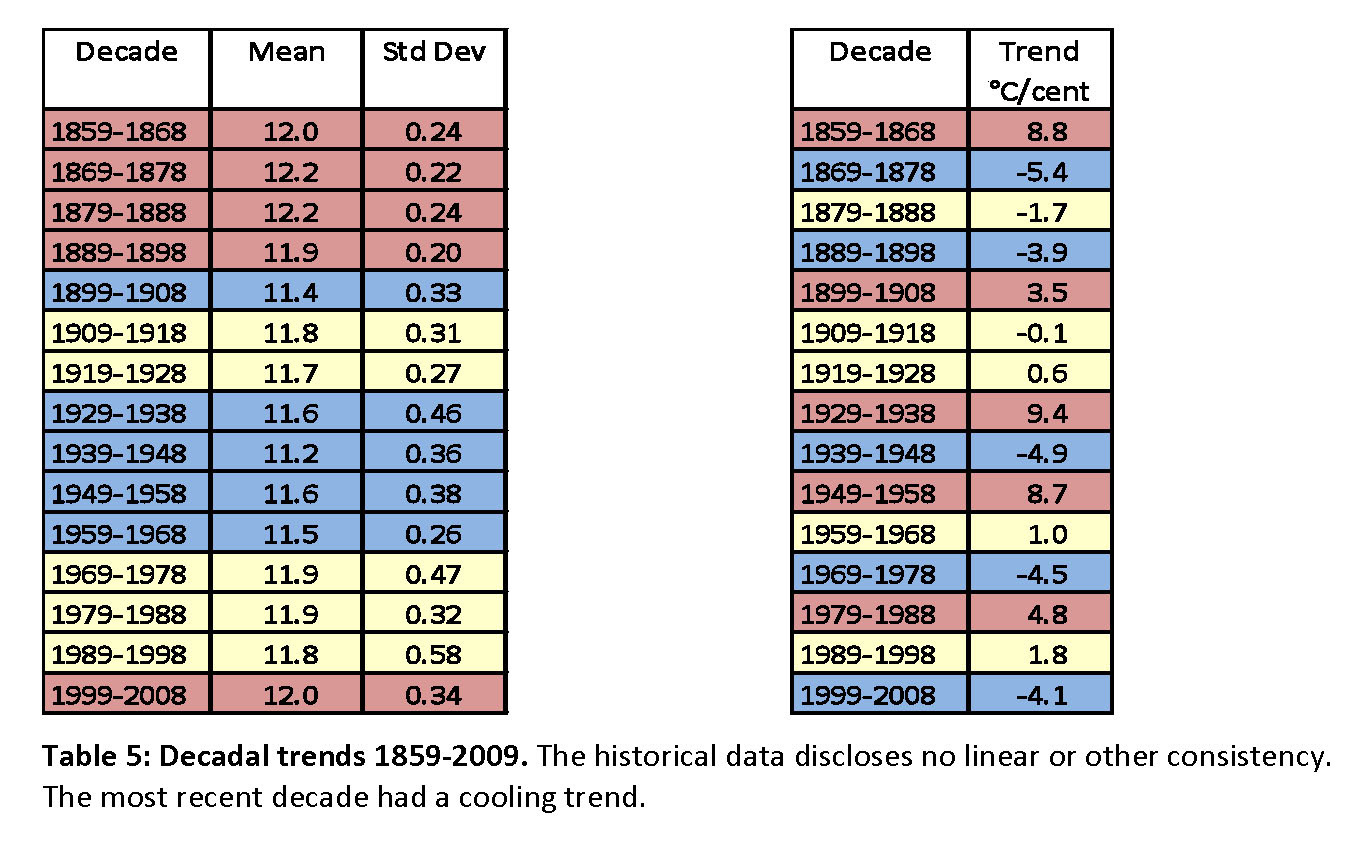
In July last year the NZ Climate Science Coalition published an independent analysis of NIWA’s reconstruction of our national temperature record (NZTR) entitled New Zealand – Unaffected by Global Warming.

It’s the only independent analysis carried out on the reconstruction (nobody else has bothered). As far as I know, nobody much has even read the report. So we need to tease out some of the details and start talking about them. They’re a bit startling, considering the diet of alarm we’ve been getting from the news media for the last twenty years.

What would Kiwis do if they knew the facts of the country’s temperature record? Would they demand the government ditch the ETS because there’s no reason for it? Would they march on Parliament?

Because one of the insights from our expert analysis is that there’s been neither unprecedented warming nor strong recent warming in New Zealand, despite claims of both from the alarmists. Continue Reading →

Views: 68

NOAA conducts Orwellian revision of empirical evidence

fabricating data

From American Thinker via C3.

This came up a few days before Christmas. I didn’t get to it then but it needs airing. The surface temperature series of GISS and HadCrut are scarcely worth the disk drives they’re stored on. No wonder the records show warming.

It’s a joke. The shocking truth is that the oldest readings have been cranked way down and later readings artificially lifted to give a false impression of warming. That seems familiar — now where have I read that before

NOAA changes old temperature records every month. This is a new climate sport in which we imagined Kiwis led the world. But the Yanks have more stamina. They don’t just do it once, they keep on doing it. The data-altering champions in NOAA and NASA put the climate scientists in NIWA to shame. Continue Reading →

Views: 365

Climate lies in high places

everybody lies

Hand-in-hand with the IPCC theory that we’re dangerously changing the climate go many inaccuracies, distortions and outright lies supporting its stupendously false diagnosis, ruinously expensive remedies and tyrannical administration.

The distortions have wormed their way into thousands of places, both public and private, open and secret, taking our taxes and governing us in ways we’re already forgetting, even if we knew when they began. Will we ever be rid of them?

For to destroy each of the distortions, you need time and patience to find references to, references against and develop a refutation. Then you wait for people to hear about it and agree with you. It’s slow work.

Here’s one of the lies: mankind is ruining a perfectly good climate which never changed before we came along. Continue Reading →

Views: 79

Real Climate smashes methane disaster theory

David Archer, contributor at Real Climate, gives much reassurance today about the dangers of methane clathrates. Interesting article, with lots of things I hadn’t heard of. Nice of him, too, to put our minds at rest.

I wonder why he didn’t explain all this long before now, about ten years ago or more? Why he let all the wild, alarming speculation continue in the world’s press and in the blogs for quite so long. Why he let us worry for so long. Why, especially, he now calls us “friend” (see the end).

He says the ocean hydrates are “mostly so deep in the sediment column that it would take thousands of years for anthropogenic warming to reach them.” Well, that’s a good piece of sense, David; thanks for bringing it up. I’m sure some of us have said so already, but good of you to confirm it. Continue Reading →

Views: 39

Cloud watching

I am sent this snippet of correspondence that refers intriguingly to continuing research into the effect of clouds on the climate. No, I won’t say who’s speaking.

Your reference to clouds led me to the work of Prof Roger Davies, who holds the Buckley-Glavish chair in Climate Physics at Auckland U.

He is part of a global group triangulating cloud data from a dedicated satellite, and seems to be developing a view that clouds provide a natural thermostat function (which Richard Lindzen has previously speculated about).

This comes from a 2008 article “Watching the Clouds” in the science faculty magazine:

Over the past eight years of data, there has been little change in the clouds over much of the Earth. However two regions stand out as exceptions. Near the equator, where the high clouds that determine the greenhouse effect are especially numerous, the cloud cover has dropped in height, suggesting a lowering of their greenhouse effect, potentially to offset global warming.

In addition, the reflectivity of the Arctic has changed. In northern summer 2006, the reflectivity of the Arctic decreased significantly, due to less cloud cover and less ice in the area, both of which reflect sunlight. However, from the ground, only a moderate decrease in ice was seen compared to its normal summer melt. The following year, there was a significantly higher ice melt than predicted, despite the fact that satellite pictures were brighter than average, and much brighter than the previous summer, due to increased cloud.

But was the 2007 melt due to the darkness of 2006? Were the clouds of 2007 compensating for the low ice reflectivity to keep a balance? Right now, we don’t know enough to say.

Interesting, but Google shows up nothing recent. He generally seems to keep his head down.

/end snippet

Views: 347

Global warming spreads by word of morph

Here in New Zealand, the NZ Climate Science Coalition has battled for several years to understand the national temperature record and get the data released that lies behind it. Now we battle to correct it.
 
Because NIWA, in “reconstructing” the record, manages miraculously to lower past temperatures and increase recent ones to create a spurious warming that overstates the actual national warming over the last hundred years by 168%!
 
We’ve told NIWA about it and we’ve sent them our report that proves it, but they refuse to acknowledge our finding, much less explain themselves. It is a national disgrace which our newspapers, magazines, radio stations and television channels strangely refuse to investigate.
 
The warming is truly man-made, for it hasn’t happened in the real world, it has been created only by the adjustments.
 
Now, from C3 Headlines, we learn that an even more invidious process has been going on in the United States. Continue Reading →

Views: 55

Does this destroy sceptical arguments?

This is surely too good to be true for the warmists.

In the last few days of a failing international conference, here’s a paper carrying strong confirmation of global warming. It’s not attribution, of course, but nobody will notice that. Proof of warming is enough to tweak the guilt nerve.

The Washington Post says:

The global temperature series is one of the clearest pieces of evidence that the planet is heating up. Over the past century, it’s easy to see from, say, NASA’s data that surface temperatures have risen dramatically. But there’s also a fair bit of short-term natural fluctuation from year to year, which can sometimes obscure what, exactly, is going on.

Continue Reading →

Views: 83

Pearls from the giant evil IPCC clam

Climate crisis called off

UPDATE 1500 NZDT – see below

The Intergovernmental Panel on Climate Change (IPCC) has published the Summary for Policymakers (SPM) to a Special Report, Managing the Risks of Extreme Events and Disasters to Advance Climate Change Adaptation (SREX). (Actually, they haven’t.)

The SPM (I’ll call it the “report” from now on) is remarkable in its candour. The IPCC, once wanting to become the world’s evil overlord, with fingers in public and private pies everywhere to compel compliance with its anti-carbon agenda, acknowledges its ignorance and uncertainty about the climate.

The evil giant has finally spewed forth something wholesome. Continue Reading →

Views: 389

Errors remain

Earth’s temperature has never been taken, actually

A story, Analysis confirms global warming data, accounts for urban heat islands, appeared in the Science Media Centre (SMC) on 21 October. I missed it then, but it’s been brought to my attention in correspondence within the Climate Science Coalition.

A member saw the SMC story and commented:

Wratt and Renwick are quick to assert that this non-peer-reviewed temp study reinforces their suspicion that UHI is an insignificant factor. They both refer to numerous other authorities. I thought the leading paper supporting this view was Phil Jones’ China study of about 1991, which he has recently admitted to be based on a mistake. Are there any others which debunk UHI?

This raises several interesting elements which I’d like to follow at some time, but it also prompted this succinct analysis from the evergreen Dr Vincent Gray, who responded: Continue Reading →

Views: 43

Suppression of sceptical views continues

Climate Realists carried a letter from John O’Sullivan on 2 November, claiming ill treatment at the hands of Suite101.com, in terminating their publishing arrangement with him. I note that two of O’Sullivan’s articles are still available at Suite101 but this is his letter:

Friends,

I write to announce my employment with my publishers, Suite101 was terminated today without prior notice or explanation and all my articles published over a two-year period with them are now removed from the Internet. I believe this is in retaliation for my latest article ‘New Satellite Data Contradicts Carbon Dioxide Climate Theory’ revealing the shocking fact that the Japanese ‘IBUKI’ satellite measuring surface carbon dioxide emissions shows that Third World regions are emitting considerably more CO2 than western, industrial nations. Continue Reading →

Views: 330

Reducing emission’s a mission

Now where should we start?

How confusing is this?

Climate Realists announce that new satellite data from Japanese scientists show carbon dioxide is emitted mostly by the third world, with much less coming from industry in the west. For those asleep in the back, that’s the reverse of our previous understanding (so it’s a confusing result). On the map, pink is where emissions are occurring, green is where absorption is occurring.

IBUKU satellite CO2 data

Life is now officially upside down — the giant northern hemisphere economies are not emitting CO2 after all, they’re absorbing the stuff! Continue Reading →

Views: 97

Gas or coal? The quandary, the indecision!

coal protest

It’s hard to know what to say about Tom Wigley’s new paper on the climatic repercussions of replacing coal with natural gas: he says gas and coal are both good, and they’re both bad, but the truly remarkable thing is that, where for years the greens have been telling us to hate coal and everyone who uses it, now it’s hard to choose between coal and gas.

It doesn’t matter whether you believe mankind is warming the planet dangerously or not, Wigley tells us that it makes hardly any difference to the warming whether you use gas or coal. So why switch to gas? There’s no advantage in it. Continue Reading →

Views: 60

Our CO2 emissions are not the half of it

human CO2 emissions

Two days ago we heard about the long-term trend in atmospheric carbon dioxide emissions, copied above.

This graph functions as a fine graph of productive output, and doesn’t it reveal the new world order? The countries with the highest emissions are (broadly speaking) doing the most work, making the most money and having the most influence.

It was ever so. If our leaders wake up to that simple fact they might be able to make sensible plans to maximise our work. Perhaps improve on the half-baked notion of a magic “knowledge economy” — as though knowledge alone would succeed without the application of intelligent planning, consistent effort and good service. Continue Reading →

Views: 57

Miraculous: computer game finds missing heat

Argo buoy being deployed

From today’s Summit County Citizen’s Voice, we read Bob Berwyn’s account of Kevin Trenberth’s favourite paper so far this century.

Global warming: ‘Missing’ heat found deep in the ocean

Changes in ocean currents and circulation are capturing some of the sun’s incoming heat deep in the ocean, according to researchers with the National Center for Atmospheric Research, who said their latest computer models account for some of the global warming heat that’s “missing” from land and sea surface temperature readings.

This implied that heat was building up somewhere on Earth, according to a 2010 study published in Science by NCAR researchers Kevin Trenberth and John Fasullo.

Observations from a global network of buoys showed some warming in the upper ocean, but not enough to account for the global build-up of heat. Although scientists suspected the deep oceans were playing a role, few measurements were available to confirm that hypothesis.

To track where the heat was going, Meehl and colleagues used a powerful software tool known as the Community Climate System Model, which was developed by scientists at NCAR and the Department of Energy with colleagues at other organizations.

Well, well, who would have thought? All the missing heat, safe in the ocean deep, alive and well, having nipped through the upper reaches of the ocean without warming it. I never guessed — did you? Truly amazing.

But there’s no data, just more modelling

The computer game doesn’t care about realism, so the lack of any plausible mechanism whereby the heat might have reached more than 1000 ft (305 m) deep while leaving the upper levels unwarmed didn’t affect its findings.

When the game “found” extra heat deep in the ocean, there was nothing to say “that’s impossible.”

So, because they’re real scientists, we can expect an announcement very soon of a new study aimed at discovering how the missing heat got to where it was found.

One day they’ll get around to actually observing the climate effects they report. When they do, you can read about it here!

Views: 54

NIWA’s sham: but wait — there’s more

holy grail

Independently peer-reviewed scientific papers published in learned journals are the Holy Grail of climate science alarmists, and the IPCC in particular. So they want to get friendly papers in and keep contrary papers out.

The Climategate emails show continuous collusion between members of the “Hockey Team” to prevent journal publication of any paper which challenged the IPCC dogma. Because, once published, a paper becomes part of “the scientific literature” and authors are obliged thereafter to take it seriously.

Of course, the IPCC manipulates the system outrageously. After Chairman Pachauri assured the media that it disregarded non-peer-reviewed opinions, revelations came that more than one-third of the material used by some Working Groups came from the “grey” literature (usually written by Big Green activists).

NIWA closely follows the party line. That’s why it has insisted endlessly that the New Zealand temperature record (NZTR) included adjustments “described in the peer-reviewed scientific literature” which were “in accord with internationally accepted techniques.” Continue Reading →

Views: 77

CLOUD proves cosmic ray link

See commentary on WUWT.

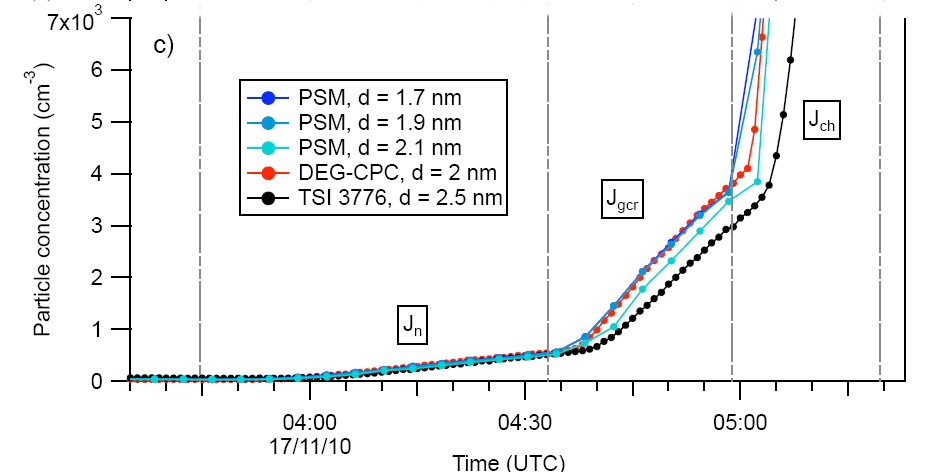
Nature has just published Cloud formation may be linked to cosmic rays, which acknowledges results from an experiment at CERN probing a connection between climate change and radiation bombarding the atmosphere.

[In comments, Alan Burke quickly diminishes the significance.]

In the meantime, Nigel Calder posts CERN experiment confirms cosmic ray action, nailing confirmation of such a “connection” to the scientific wall.

You can draw your own conclusions from the revealing graph he gives:

CLOUD results

Take your pick between Nature and Calder. Is the link alleged or confirmed? Is there a non-GHG-induced magnification of solar influence on cloud formation, and therefore global lower tropospheric temperature, or not?

This must give Nick Smith cause to review our ETS.

Stand back as the warmists rush the exits.

Views: 155

Incredible sham from NIWA

NIWA shows 168% more warming

NIWA didn’t use Rhoades & Salinger. We can prove it. They lied.

NZ Climate Science Coalition statisticians have uncovered evidence of scarcely believable deception from our National Institute of Water and Atmospheric Research Ltd (NIWA).

Last December, NIWA released a reconstructed NZ temperature series Report on the Review of NIWA’s Seven Station Temperature Series (“7SS Review”) (pdf, 8.5 MB). It has a fresh new graph (below) that’s all but indistinguishable from the previous graph. But that’s not the point.

The point is the new series is a lie. Continue Reading →

Views: 1953

What warming?

what warming?

NIWA’s data confirms: little warming

When it’s calculated correctly

Why did they lie to us?

In December last year, NIWA released their long-awaited review of the NZ temperature record (NZTR). We’ve reviewed that report and found serious errors. NIWA used the wrong method and created strong warming. We used the right method and found mild warming.

There are a few things we need to understand about weather stations. The first is that these stations sit there for a long time. Some of them have been in the same place for 80 years and more. If you sat in one place for that long, you’d see stuff happening around you — same for the weather station.

Trees grow, buildings go up, airport runways get covered in tarseal or concrete, roads appear, and these and other non-climatic influences affect the temperature readings, usually making them warmer, but not always. Sometimes the station gets moved, and it’s always better to keep all that history if you can, so you try to adjust it rather than start again with a new station.

NIWA had to start from scratch

Knowing this, when scientists examine a series of temperature readings they look for what has changed at the different stations. If the changes affected the temperature readings, they adjust the readings. Continue Reading →

Views: 85

Climate models get energy balance wrong

HUNTSVILLE, Ala. (July 26, 2011) — Data from NASA’s Terra satellite show that when the climate warms, Earth’s atmosphere is apparently more efficient at releasing energy to space than models used to forecast climate change have been programmed to “believe.”

The result is climate forecasts that are warming substantially faster than the atmosphere, says Dr. Roy Spencer, a principal research scientist in the Earth System Science Center at The University of Alabama in Huntsville.

Read more…

Views: 351

Simple test shows sulphates not cooling

There is no statistically significant warming trend since November of 1996 in monthly surface temperature records compiled at the University of East Anglia. Do we now understand why there’s been no change in fourteen and a half years?

Well, yes, because “blame” for this interruption in warming has been placed on sulphates emitted by China’s power stations zealously burning coal. Hasn’t it?

Has this hypothesis been tested? No. Can it be tested? Yes.

Most of the aerosols are in the northern hemisphere, and there’s little mixing of air between the hemispheres. Reason tells us that the northern hemisphere should be cooling and the southern hemisphere should be warming.

Well, go on, this is the big test, look it up. Continue Reading →

Views: 56

de Freitas on solid ground

what is weather

(h/t Bob D for most of the references)

Journalist Chris Barton has a story in yesterday’s Herald titled The climate dissenter holds his ground. After looking at Barton’s alarmist arguments I’ll stand with Chris de Freitas on the solid ground.

The story begins with the implication (not that the journalist says it this plainly) that, even with the planet battling weather extremes, that is not enough to convince an Auckland climate scientist (Associate Professor Chris de Freitas, at the University of Auckland) of the truth of human-induced global warming. We’re supposed to feel exasperation: “What will it take to get that man to see sense?”

But Barton is dead wrong. For why should “extreme” weather be an indication of man-made global warming? How could we get more extreme weather out of global warming? Continue Reading →

Views: 132

Species decline or scaremongering?

tiger in the snow

A study from the University of Exeter on species decline declares “climate change warnings not exaggerated.”

However the press release leaves one singularly unimpressed with the raw activism of the lead researcher, who says: “It is time to stop using the uncertainties as an excuse for not acting. We need to act now to prevent threatened species from becoming extinct. This means cutting carbon emissions.” Continue Reading →

Views: 116

Climate science learns more — not settled at all

sky, location of climate

Yesterday I saw the headline: Climate change reducing ocean’s carbon dioxide uptake. If they mean the temperature’s been rising, I thought, these guys need a lesson in 1) recent, 15-year-long atmospheric temperature non-rise and 2) the gas laws, or specifically, Henry’s Law.

Henry’s Law states that the solubility of a gas in a liquid at a particular temperature is proportional to the pressure of that gas above the liquid. If the temperature of the liquid rises, it can’t hold so much gas, so some will leave (“outgas”). It hardly requires a paper based on 28 years of observations to confirm this. Continue Reading →

Views: 165

Now sea levels are rising fast

Rash of news alerts

From News.Scotsman.com comes worrying information of rapid sea level rise.

Global warming is causing sea levels to rise at a faster rate today than at any time in the past 2,100 years, according to new research.

Scientists used the fossils left by tiny marine animals to record two millennia of sea levels along the US Atlantic coast.

Some inspired comments

In the most detailed look yet at sea level change, scientists on Monday reported that waters along the East Coast have risen far faster over the past century than at any time in the previous 2000 years. [Philadelphia Inquirer]

20th-Century sea-level rise on the U.S. Atlantic coast is faster than at any time in the past two millennia. [Real Climate]

The research confirms what has often been assumed, that there’s a very strong link between sea levels and temperatures. More worryingly, it also seems to confirm just how uniquely pronounced the current climate change really is. [io9]

Views: 35

Wool gets in the eyes

wool over eyes

Royal Society banner

With the Royal Society smoke ‘n’ sea level rise

Last September, the Royal Society published a report entitled “SEA LEVEL RISE Emerging Issues”, available as a pdf (645 KB). In the accompanying press release they had this to say:

Professor Keith Hunter, the Society’s Vice President of Physical Sciences, who contributed to the paper, says researchers are starting to be able to estimate the amount of rise that we should expect to see over this century and beyond. But he says these projections of future sea level rise depend upon the future melting of ice sheets, which is poorly known.

“The uncertain knowledge about ice sheet behaviour is the key reason why IPCC projections in 2007 did not state upper bounds for sea level rise. Similarly, Ministry for the Environment guidance in 2008 wisely left open the question of any upper limit on sea level rise.”

The paper states that some early scientific work into the effect of a warming climate on ice sheets in Greenland and Antarctica suggested that many metres of sea level rise could occur within a century. However, it says few scientists now consider that such rates are possible.

What do we learn from this?

We learn that we can’t guess future sea level rise, since we can’t guess future ice sheet melting; our mates at the UN and the MfE won’t touch it, and our first guess was several metres but now only the cranks go that far.

The press release expresses complete ignorance on future sea level rise. Great. So we also learn that scientists can make complete ignorance appear very interesting. Continue Reading →

Views: 125

Slowing Sun = cooling Earth

Science story of century

Mini Ice Age on way?

Strange happenings in the sun

End of global warming?

At WUWT Anthony Watts announces: The American Astronomical Society meeting in Los Cruces, New Mexico, has just made a major announcement on the state of the sun. Sunspots may be on the way out and an extended solar minimum may be on the horizon.

“This is highly unusual and unexpected,” Dr. Frank Hill, associate director of the NSO’s Solar Synoptic Network, said of the results. “But the fact that three completely different views of the Sun point in the same direction is a powerful indicator that the sunspot cycle may be going into hibernation.”

Spot numbers and other solar activity rise and fall about every 11 years, which is half of the Sun’s 22-year magnetic interval since the Sun’s magnetic poles reverse with each cycle. An immediate question is whether this slowdown presages a second Maunder Minimum, a 70-year period with virtually no sunspots during 1645-1715.

“We expected to see the start of the zonal flow for Cycle 25 by now,” Hill explained, “but we see no sign of it. This indicates that the start of Cycle 25 may be delayed to 2021 or 2022, or may not happen at all.”

All three of these lines of research to point to the familiar sunspot cycle shutting down for a while.

“If we are right,” Hill concluded, “this could be the last solar maximum we’ll see for a few decades. That would affect everything from space exploration to Earth’s climate.”

h/t Andy Scrase.

Views: 394

Some questions for the BoM’s FOI executive

Warwick Hughes’ request under the Australian Freedom of Information Act (FOIA), has been declined by the Australian Bureau of Meteorology (BoM) on the grounds that it might divulge information supplied “under an obligation of confidentiality” by a foreign Government to the Australian Federal Government.

The Court ruling which established this exemption to the FOIA dealt with a case involving intelligence-sharing with the Australian Security Intelligence Office (ASIO). In contrast, Mr Hughes’ case dealt with old weather records.

Several questions arise

1. Did NIWA impose an obligation of confidentiality on the Bureau?

It seems clear that neither party even thought about confidentiality until the request was made. Continue Reading →

Views: 129

What are the Aussies hiding?

Australian storm

In Australia, Warwick Hughes has followed with interest our attempts to obtain from NIWA details of their adjustments to the NZ temperature record. When the Bureau of Meteorology (BoM) supplied a letter apparently certifying the Bureau’s “peer review” of NIWA’s review of the temperature record, he noted our complaint that “there must be more than this.”

Hearing of my request to NIWA for records relating to that review by the Bureau, he was minded to help. So, back in February, he filed a Freedom Of Information (FOI) request with the Australian Information Commissioner.

In response to that FOI request, the Bureau submitted to the Information Commissioner a Schedule of Documents dated 6 May 2011.

Somebody at the Bureau has put in hours of work tracking these documents down, describing them, analysing their relevance to Warwick’s request and assessing whether they met the provisions for exemption. Well done, them.

The schedule describes 159 relevant documents, amounting to several thousand pages, and what do you know? The BoM claims full exemption from the FOI Act in respect of every single page! Who could have predicted that? Continue Reading →

Views: 83

NIWA correspondence safe in hands of the BoM

What a secret!

See UPDATE, below.

Here’s a development that threatens to place publicly-funded weather data on the same footing as the next budget, or troop movements.

In February, Warwick Hughes lodged a Freedom Of Information request to the Australian Bureau of Meteorology to release all documents connected with their peer review for NIWA of NIWA’s review of their seven station series (7SS).

Today, Warwick posted a story about it, Australian FOI law keeps secret the construction of New Zealand seven station temperature series.

What’s so secret about temperature records?

In frustration, Warwick laments: “I am hoping that people smarter than I might see ways to carry on the battle to get these papers and files released. What can be so secret about the things publicly-funded scientists and bureaucrats do to adjust common or garden weather records into a form that suits them? We are not talking about nuclear weapons secrets here.”

I agree. Let’s hope someone with legal expertise and a desire to uncover the truth can pick up Warwick’s endeavour and move it forward.

The NZ situation

We’re waiting for the outcome of an investigation by the Ombudsman into NIWA’s refusal to release to me similar documents related to the peer review.

UPDATE

The BoM, in a document setting out their Reasons for Refusal, reveals that no fee was paid to them by NIWA for the peer review.

Views: 73

Why is Greenland losing ice?

New report seems to assume it’s melting, but is it?

Greenland is the world’s largest island, about 2600 km long and 1100 km wide at its widest point. Most of the interior is covered by the world’s second-largest permanent ice sheet. Average temperatures rise above freezing only briefly, during the summer. Here’s a simplified graph of monthly temperatures taken from a tourism site.

Greenland temperatures

Yesterday the NZ Herald reported a study finding faster melting of Arctic and Greenland ice. The scientific team thinks global sea levels could rise by as much as five feet (1.5 metres) this century. Continue Reading →

Views: 87